
Real-Time Sales Reporting for Live Events

Key Takeaways
Real-time sales reporting turns a live event from a black box into an operation you can steer while it is still running.
- Revenue by stand, device, vendor, and hour is the base layer, and every useful decision made during an event starts there.
- Per capita spend read mid-event tells operators where to add staff, open a bar, or move product before the window closes.
- Live dashboards and post-event reconciliation solve different problems, and treating one as a substitute for the other costs money.
- Cashless transaction reporting shortens the distance between the last sale of the night and money landing in vendor accounts.
If your sales numbers arrive the week after load-out, you are running your next event on last year's guesses.
A festival bar runs dry on its best selling product at 8:40 p.m. The operator finds out on Tuesday. That gap between what happens on site and when anyone knows about it is one of the most expensive problems in live events, and it is completely fixable. Real-time sales reporting is what closes it, and it has quietly become a deciding factor when operators pick a live event payment platform over a general purpose one.
The money moving through venue technology backs this up. The global smart stadium market was worth more than $8 billion in 2024 and is projected to pass $38 billion by 2033, according to research on stadium investment trends. Much of that spend goes toward systems that generate data, and sales data is the most immediately actionable kind an operator gets. Here is what live sales data tracks, how live per-cap changes decisions mid-event, where dashboards end and reconciliation begins, and how faster reporting feeds faster payouts.
What Does Real-Time Sales Reporting Track at a Live Event?
Sales reporting at an event is not one number on a screen. It is the same revenue figure sliced several ways, and each slice answers a question somebody on site has to decide within minutes. The reporting earns its name only when the slices arrive while the decision still matters.
Revenue by Stand, Bar, and Location
The most basic view is money per selling location. A twelve bar site never performs evenly, and the variance is usually wider than operators expect. Two bars fifty yards apart can differ sharply in hourly revenue because of foot traffic, sightlines to a stage, or whether the queue sits in the shade. Seeing that split live lets a production lead move bartenders off the quiet stand and onto the line that is backing up.
Sales by Device and by Staff Member
Underneath location sits the individual terminal. Device level data shows how many transactions each unit processed and the average ticket it rang, which is how you find the two registers carrying a six-register bar while the other four coast. Staff level attribution goes one layer deeper, showing who rings higher average tickets and where a crowd standing right in front of a counter is failing to convert. That is a coaching signal and a scheduling signal in the same view.
Revenue by Vendor Across the Full Site
Events hosting independent sellers need vendor level totals as their own view. When one venue umbrellas dozens of merchants, the operator carries responsibility for revenue that legally belongs to other businesses. Handling payments across multi-vendor events properly means tagging every transaction to a vendor the moment it happens, so vendor dashboards and venue-wide totals draw from one source. Vendors who watch their earnings accumulate during service are easier to work with than vendors waiting a week for a statement they cannot verify.
Sales by Hour Against the Run of Show
Time is the slice most operators underuse. Revenue by hour, mapped against set times, gate opening, and weather, explains almost every anomaly that would otherwise look like a failure. A dead thirty minutes usually lines up with a headliner taking the main stage, not a broken bar, and a spike before a set change is a cue to preposition inventory next time. Event sales analytics that ignore the clock describe what happened without explaining why.
How Do Operators Use Per-Cap Reporting While Doors Are Open?
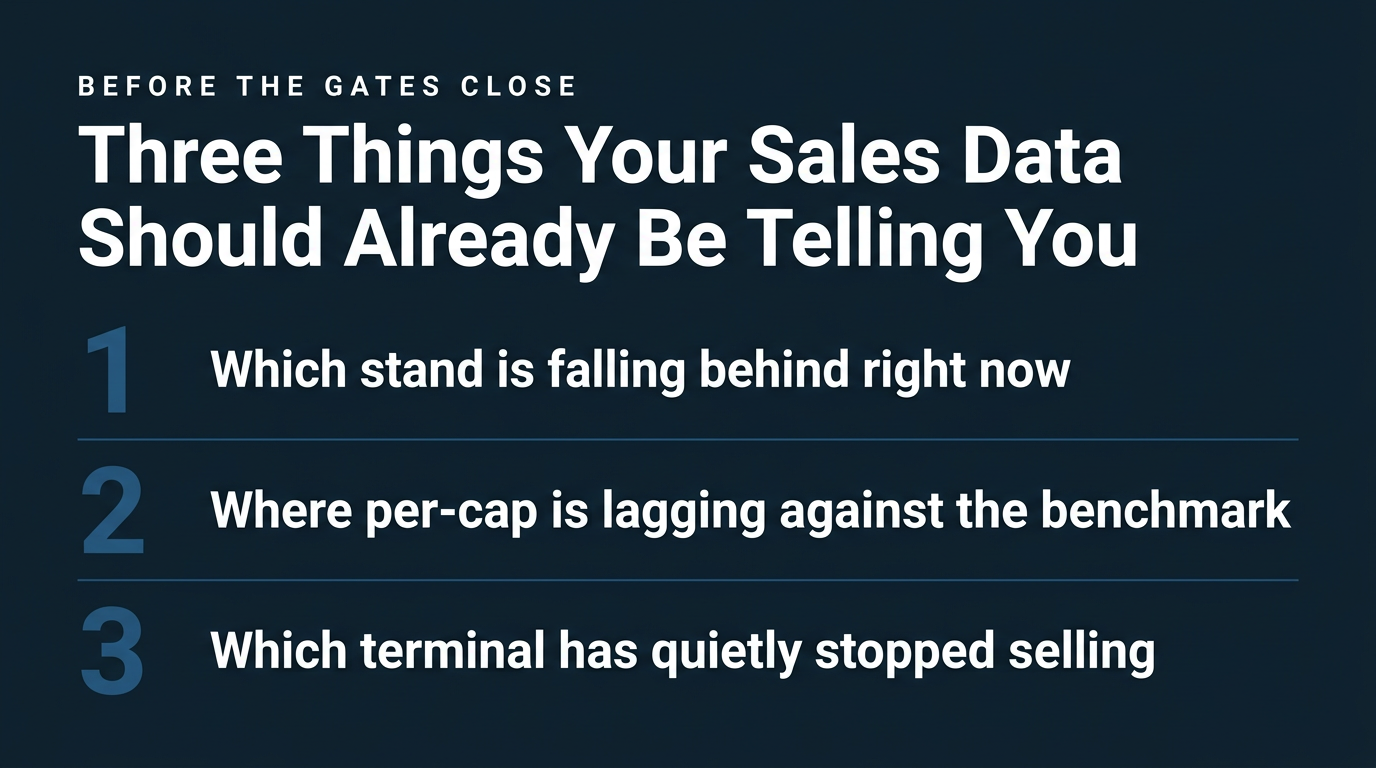
Per capita spend is the number quoted in board meetings and the one that decides whether an event actually grew. Most operators calculate it after load-out. Per-cap that updates during the event is a different tool entirely, because it turns a scorecard into a control.
Reading Per-Cap Before the Event Ends
Live per-cap is total sales divided by attendees on site at that moment, refreshed as both numbers move. Watched hourly, it shows whether spend is tracking against comparable events or quietly falling behind. A per-cap running low with four hours of trading left is a problem you can still fix, and fixing it changes the number the event closes on.
Turning a Per-Cap Gap Into a Mid-Event Move
The corrective moves are simple and physical. Open a satellite bar to shorten a queue people are abandoning. Push a bundle at terminals in sections where average ticket is lagging, or move roaming staff into the crowd between sets. None of this needs exotic technology. It needs somebody to know the gap exists before the crowd goes home.
Live Dashboards or Post-Event Reconciliation: Which One Do You Need?
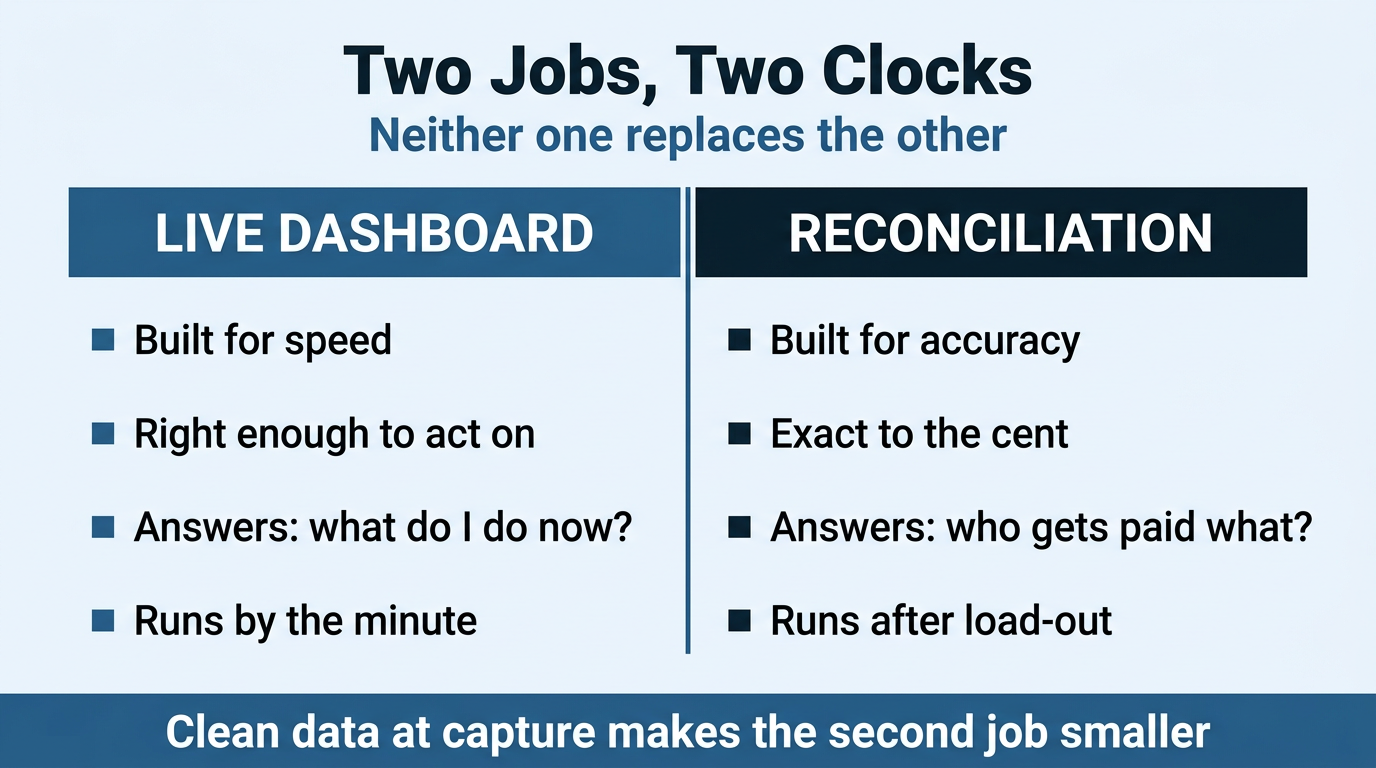
This is a false choice operators keep making anyway. Real-time event reporting and reconciliation answer different questions on different clocks, and they demand very different levels of precision. Confusing the two is how operators end up with a dashboard nobody trusts and a finance process nobody can finish.
What a Live Dashboard Is Built For
A live dashboard exists for speed and direction, not accounting accuracy. It has to be right enough to justify a decision in the next fifteen minutes. If it shows the north bar running at half the volume of the south bar, that is actionable whether or not the figure is exact to the cent. Putting real-time data into event operations works because approximate and immediate beats exact and late.
What Reconciliation Still Has to Do
Reconciliation is the opposite discipline. It has to be exact, because it drives vendor payouts, tax filings, sponsor reporting, and commission math. Refunds, voids, comps, chargebacks, and late-syncing transactions all have to resolve into one set of totals that survives an audit.
Real-time event reporting does not replace that work. It shrinks it, because the data was already structured and attributed at the moment of capture instead of reassembled afterward from a pile of separate terminals.
Can Real-Time Sales Reporting Catch Theft and Device Failures?
Shrinkage is uncomfortable to discuss and expensive to ignore. Retail gives a sense of scale: the average shrink rate hit 1.6 percent of sales in fiscal 2022, representing $112.1 billion in losses across US retail that year. Live events carry the same exposure with more temporary staff and a hard deadline that leaves no time to investigate later.
Spotting Shrinkage Patterns While They Are Happening
Reporting does not accuse anyone. It surfaces patterns worth a second look: a terminal running an unusual volume of voids, a stand where discounts spike during one shift, or a location whose numbers diverge from comparable stands. Each is something a floor manager can walk over and check.
Cashless transaction reporting helps mainly by removing ambiguity. Every card, wallet, and wristband sale leaves a timestamped record tied to a device, a location, and a staff login, which makes an outlier easy to see and easy to explain either way.
Catching Device Problems Before They Cost Sales
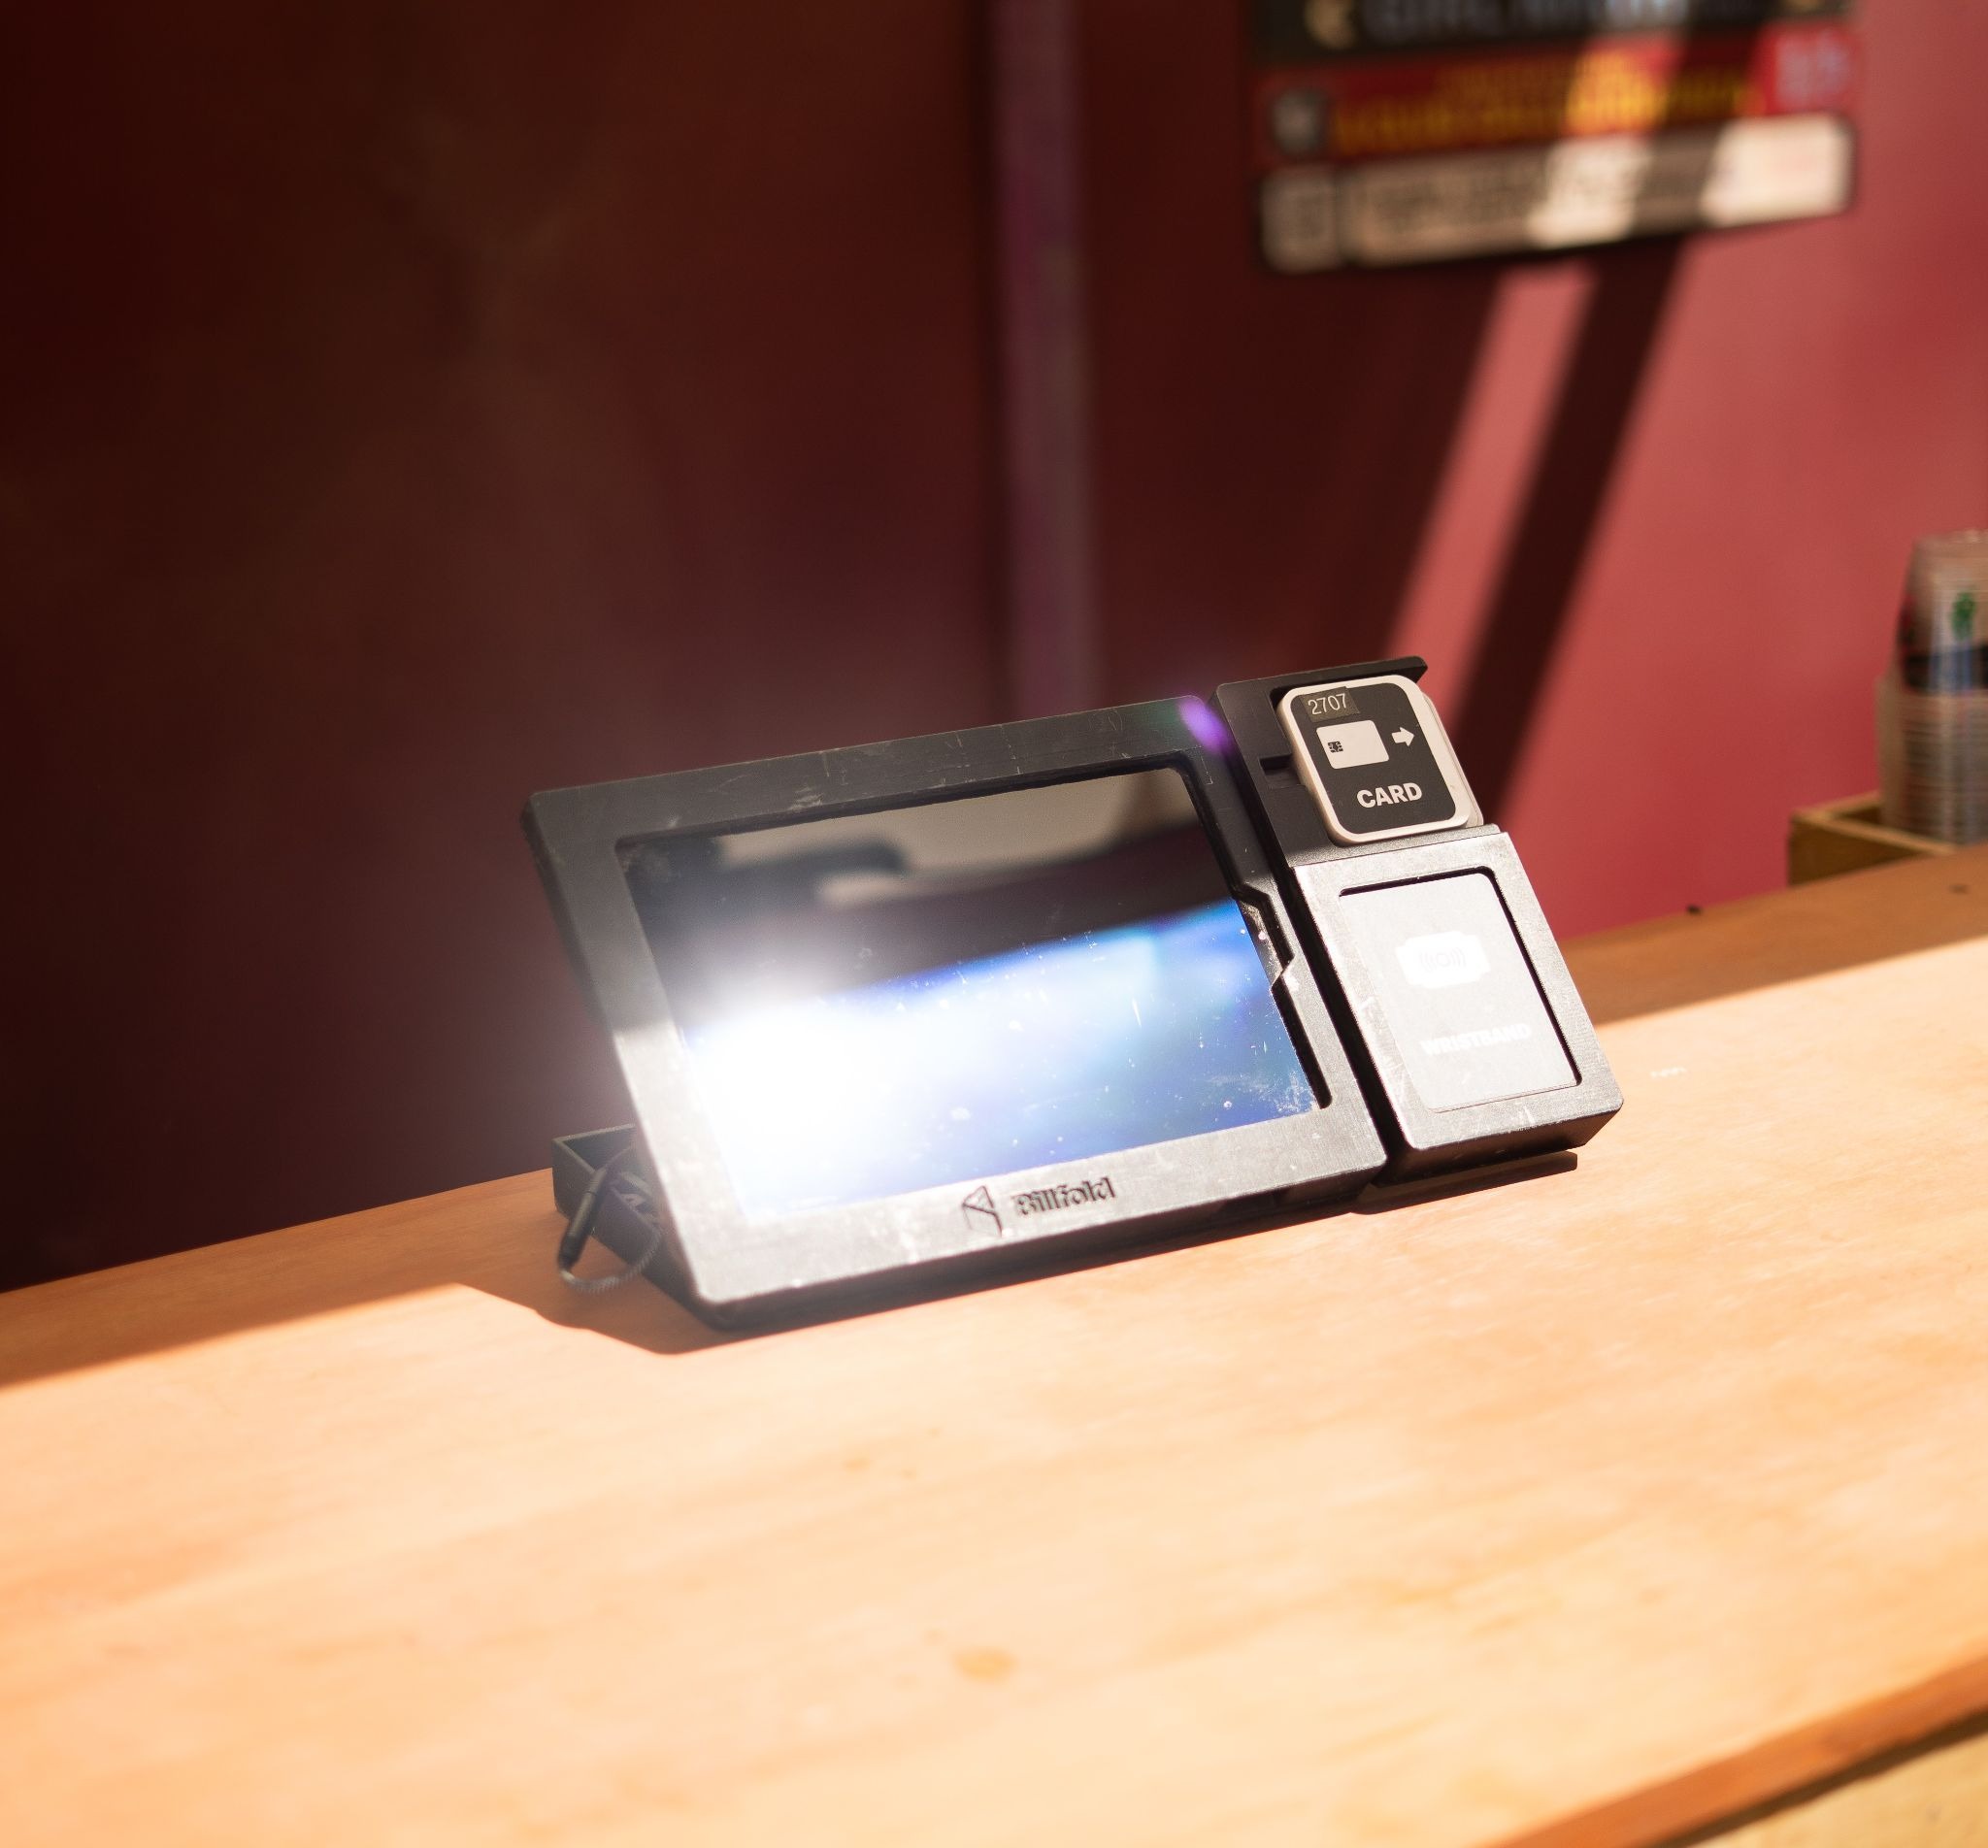
The more common revenue leak is less dramatic: a terminal that dropped off the network, a unit that ran out of charge mid rush, a screen nobody can read in direct sun. Operators running large deployments watch device health next to sales numbers, which is why monitoring hundreds of devices centrally has become standard at high volume events.
A dead terminal at a busy bar for thirty minutes is a countable loss. In the sales report alone it looks like a mysterious gap, and it stays mysterious unless somebody was watching the hardware too.
7 Numbers to Watch on a Live Event Sales Dashboard
Dashboards fail when they try to show everything at once. These are the figures worth putting on the wall during service, and they cover most of what event sales analytics are good for in the moment.
- Revenue per location per hour. The most useful view for staffing and queue decisions while the event is running.
- Live per-cap against a benchmark. Spend divided by attendees on site, compared against the same event last year.
- Average transaction value by stand. Shows where upselling is landing and where staff need a prompt or a menu change.
- Transactions per device per hour. Throughput per terminal, which exposes bottlenecks and units that quietly stopped selling.
- Top and bottom sellers by location. Inventory calls live here, including what to move between stands before a stockout hits.
- Vendor revenue and running payout balance. Keeps sellers informed and makes settlement a confirmation rather than a negotiation.
- Void, refund, and discount rate by terminal. A pattern worth investigating, though never proof of anything on its own.
How Does Live Reporting Speed Up Settlement and Next-Day Payouts?
Settlement is where reporting stops being an operations tool and becomes a finance one. Every hour spent reconstructing what sold is an hour vendors wait to get paid, and vendor patience is a real constraint on who comes back next season.
Expectations have already moved. Ninety-two percent of businesses now use some form of faster payments, and instantly available funds rank among the top motivators for adopting them. A food truck paid same day by a weekend market will not be relaxed about waiting three weeks after a festival.
Fast payouts depend on clean data at the moment of capture. When every transaction already carries a vendor ID, a location, a product, and a timestamp, settlement becomes a report you run rather than a project you staff. That is the argument for putting an event on one cashless and contactless point of sale layer, and it is why real-time sales reporting and fast settlement show up together.
FAQ
What Is Real-Time Sales Reporting at a Live Event?
It is sales data that updates during the event rather than after it, broken out by location, device, vendor, product, and hour. The point is timing more than content. The same numbers a week later are a post mortem. The same numbers at 7 p.m. are a decision you can still act on.
How Is Per-Cap Reporting Different From Total Revenue?
Total revenue tells you how much the event made. Per-cap divides that by attendance, showing how well the event monetized the crowd it actually had. A show with lower attendance and higher per-cap is often the healthier operation, and per-cap reporting is the only clean way to see that.
Do I Still Need Post-Event Reconciliation If I Have Live Dashboards?
Yes. Live dashboards are built for speed and are not the system of record. Reconciliation resolves refunds, voids, comps, and late-syncing transactions into final totals that drive payouts and tax. Good real-time event reporting makes that faster without removing the step.
Can Sales Reporting Actually Reduce Theft at Events?
Reporting does not stop theft on its own. It makes unusual patterns visible while there is still time to look into them, such as void rates that spike on one terminal or a stand whose numbers diverge from comparable locations. Paired with cashless transaction reporting, it removes most of the ambiguity that makes losses hard to trace.
Stop Running Your Event on Last Week's Numbers
The operators pulling ahead are not the ones collecting the most data. They are the ones whose data arrives while they can still act on it. Revenue by stand, per-cap against a benchmark, device throughput, and vendor balances are only worth capturing if somebody sees them during service. Event sales analytics that surface after load-out are a report nobody opens until budget season.
Billfold builds the cashless POS layer that produces this data as it happens, with one dashboard across every vendor and location and automated payouts on the back end. Reach out to the Billfold team to see what real-time sales reporting looks like across your full footprint.
